This video visualizes the cycling flow derived from BiciMAD (Madrid Bike-Share System) activity over the course of a day, including the routes of both a typical weekday and a typical weekend day. The video illustrates cycling flow in relation to the level of activity of BiciMAD stations. The results has been published in the research paper The pulse of the cycling city: visualising Madrid bike share system GPS routes and cycling flow (Romanillos, Gómez-Moya, Zaltz-Austwick, & Lamíquiz-Daudén, 2018).

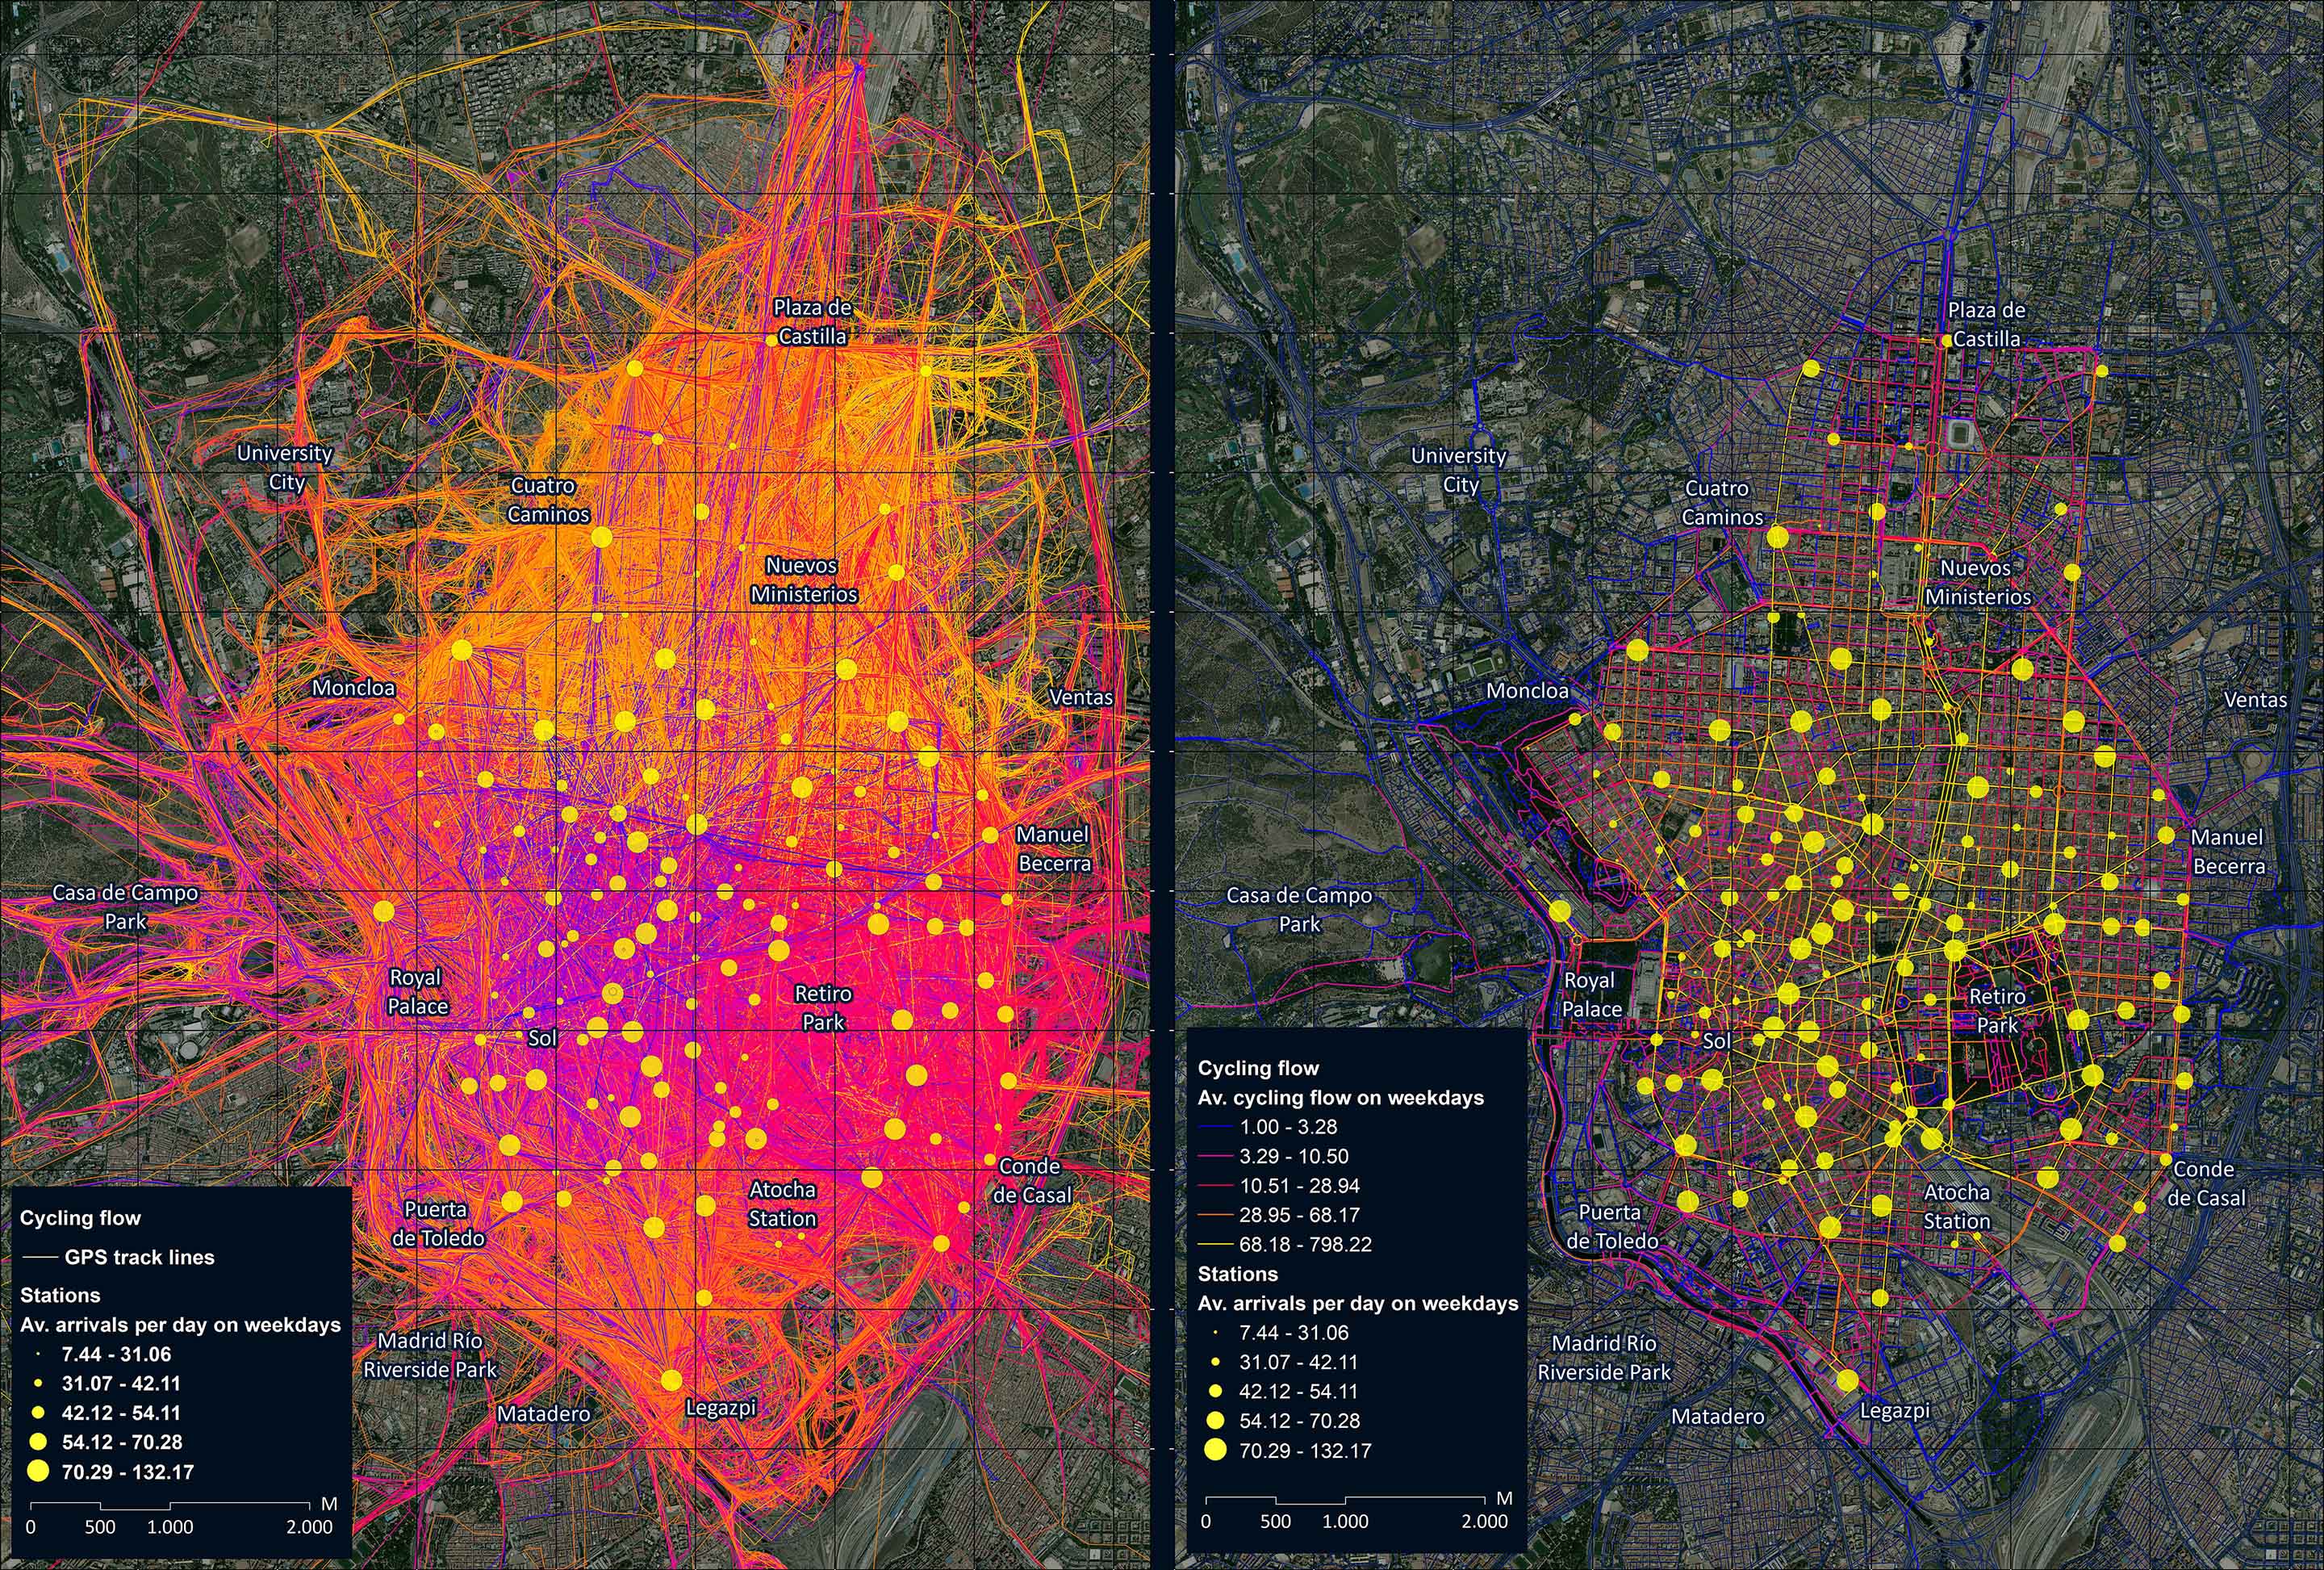
GPS tracks followed a map-matching process in order to adjust them to the street network, allowing us to estimate the average cycling flow at each street segment and at different moments of the day, or the average cycling flow values for different dates (weekdays, weekends or holidays).